How can the advantages of the filter element’s fiber structure be demonstrated using microscopic or SEM (scanning electron microscopy) data?
Two filters look identical, but one performs far better. You can’t see why, and without proof, you can’t justify choosing the more expensive, higher-quality option for your system.
SEM (Scanning Electron Microscope) images reveal a filter’s inner world. They show the fiber diameter, pore size consistency, and density structure. This data proves how a well-made filter captures more dirt, provides a reliable micron rating, and lasts significantly longer.
The first time I saw an SEM image of a filter cross-section, everything clicked for me. For years, I had seen some filters outperform others that looked exactly the same on the outside. It was frustrating. But looking at that microscopic image was like seeing the architect’s blueprint for a building instead of just looking at its facade. I could see the different layers, the way the fibers were laid out, and how the pores were structured. It was no longer a mystery why one filter lasted for months while another clogged in a week. The proof was right there, magnified 5,000 times. That visual evidence is more powerful than any data sheet, and it’s what allows engineers like us to make informed decisions based on science, not just price.
What does a uniform fiber diameter tell you about filter performance?
Your filters clog unpredictably. Sometimes they last weeks, other times just days, causing unexpected shutdowns. This inconsistency makes it impossible to plan maintenance or trust your system’s stability.
A uniform fiber diameter, clearly visible in SEM data, creates consistent pore sizes. This ensures the filter performs at its stated micron rating reliably, leading to predictable performance and a longer, more consistent service life.
Imagine building a wall. If you use perfectly identical bricks, the gaps between them will be uniform and predictable. If you use random rocks from a field, the gaps will be all different sizes. Filter media works the same way. When an SEM image shows that all the fibers are the same thickness, it means the spaces between them—the pores—are also very consistent in size. This is the foundation of an "absolute-rated" filter. If it’s rated for 5 microns, you can trust it to capture nearly every particle of that size because there aren’t larger "holes" for them to sneak through. In contrast, cheaper, "nominal-rated" filters often use fibers of varying sizes. SEM images of these filters show a messy, random structure with some tiny pores and some huge ones. The tiny pores clog instantly, while the large ones let contaminants flow right past. This is why their performance is so unpredictable.
| Feature | Uniform Fibers (SEM Verified) | Non-Uniform Fibers |
|---|---|---|
| Pore Size | Consistent and predictable | Inconsistent and random |
| Filtration Rating | Absolute | Nominal |
| Particle Capture | High efficiency at its rated size | Unreliable, allows bypass |
| Clogging Pattern | Evenly across the entire media | Rapidly in small pores, bypass in large pores |
| Service Life | Long and predictable | Short and erratic |
SEM data provides the visual proof that a filter is engineered for precision and reliability. It shows you’re buying a consistent, dependable tool, not just a roll of material.
How does graded density structure show up in SEM images?
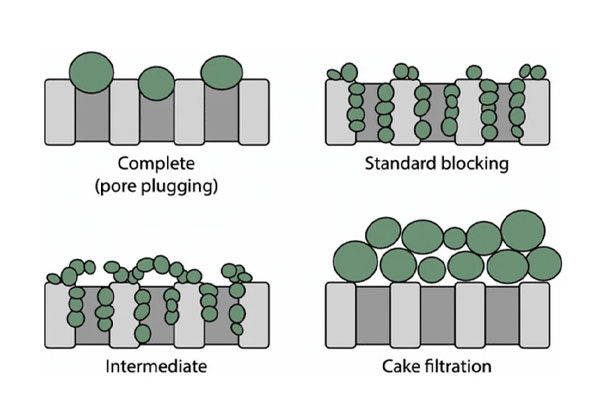
Your filter is clogging only on its surface. When you pull it out, the outside is caked with dirt, but the inside looks almost brand new. You are throwing away filters that are 90% unused.
In an SEM cross-section image, a graded density structure is visible as a transition from an open, porous network on the outside to a progressively tighter, denser fiber structure on the inside. It is a clear visual of the filter’s layers.
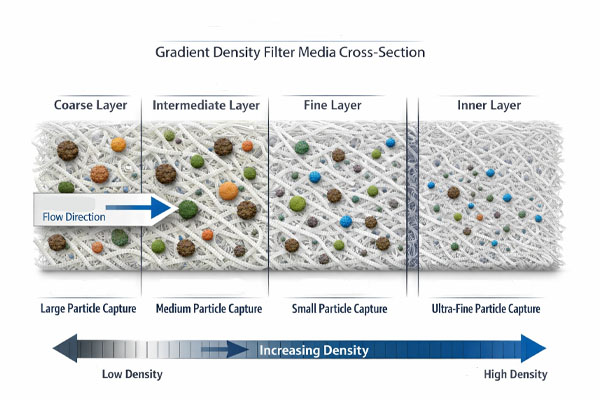
A high-performance filter works like a multi-stage classification system, and an SEM cross-section lets you see this design in action. This is often called a "graded density" or "multi-layer" construction. Instead of being a single, uniform wall, the filter is designed to work throughout its entire depth. The SEM image will show you the outer layer (the upstream side) has larger fibers and big, open pores. This layer’s job is to catch the large, coarse particles without clogging. As you move deeper into the filter on the SEM image, you will see the fibers get finer and the pores get smaller. These middle layers capture the medium-sized particles. Finally, the innermost layer (the downstream side) will appear as the densest network of the finest fibers. This is the final polishing layer that captures the smallest target particles. This design is the key to high dirt-holding capacity. It uses the entire volume of the media to trap contaminants, not just the surface. A cheap, single-layer filter is like a screen door—it clogs on the surface. A graded density filter is like a deep sponge.
Conclusion
SEM images provide undeniable proof of a filter’s hidden quality. They make the invisible visible, showing the uniform fibers and graded density structure that deliver superior performance, longer life, and greater reliability.