Running a fair filter comparison test is full of traps. A flawed setup can give you bad data, leading to a very expensive wrong choice for your project.
The essential equipment for a valid side-by-side filter test includes a dual-stream pilot skid, high-precision instruments like online particle counters and differential pressure transmitters, and a robust, automated data logging system. These components work together to ensure a fair, accurate, and data-driven comparison.

Setting up the right equipment is the first step. But the real secret to winning a comparison test is knowing exactly what data to collect and how to prove your filter’s performance. It’s about moving beyond simple observations and into hard, undeniable proof. Let’s look at the specific equipment that makes this possible and why each piece is so important for getting results you can trust.
Why is a dedicated "Dual-Stream Pilot Skid" the only way to ensure a fair side-by-side comparison?
You want to compare two filter cartridges, but running them in different conditions will skew your results. This means your expensive test is unfair, and your final decision might be wrong.
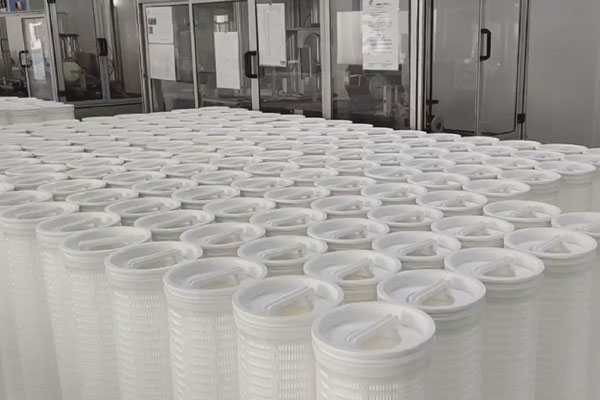
A dual-stream pilot skid is a test rig with two parallel filter housings. It takes a single water source and splits it evenly. This guarantees both cartridges face the exact same flow, pressure, and water quality, making it a true and fair head-to-head comparison.
In my years of experience with industrial filtration, I’ve seen many tests fail before they even start. The most common mistake is trying to compare filters under conditions that are not truly identical. A dedicated dual-stream pilot skid solves this problem. It is the foundation of any scientifically valid comparison. The goal is to eliminate every possible variable except for the filter cartridges themselves. If one filter gets water with slightly higher turbidity or a different flow rate, the test is compromised. A proper skid ensures this never happens. It is a small-scale version of your actual process, designed specifically for fair evaluation.
Key Components of a Fair Test Skid
A well-designed skid is more than just two pipes. It includes specific components that work together to maintain identical conditions. Here is what you need to ensure your test is fair and the results are reliable.
| Component | Function | Why It’s Essential for a Fair Test |
|---|---|---|
| Single Feed Inlet | Provides one source of feedwater for the entire skid. | Guarantees both filters start with the exact same water chemistry and particle load. |
| Manifold Splitter | A ‘Y’ or ‘T’ junction that divides the flow into two streams. | Ensures the water is split evenly, preventing one stream from getting more or less flow. |
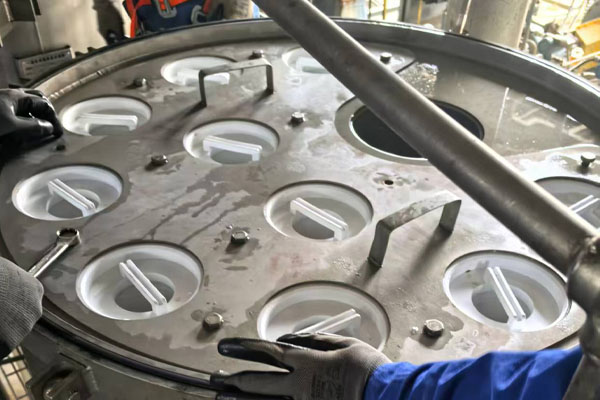
| Parallel Filter Housings | Two identical housings, one for each test cartridge. | Eliminates any variation that could come from using different housing models or sizes. |
| Independent Flow Meters | One flow meter on each stream after the filter. | Allows you to monitor and confirm that both cartridges are receiving the exact same flow rate. |
| Isolation Valves | Valves on each stream. | Allows for individual filter change-outs or adjustments without shutting down the entire test. |
By building your test around a skid with these components, you create a controlled environment. This way, any difference in performance, like pressure drop or lifespan, can only be attributed to the filter cartridge itself. This is how we get data that clients and engineers can trust.
What high-precision monitoring instruments are essential for capturing real-time filtration performance?
You believe your filter is performing well, but you have no hard data to prove it. Without precise measurements, you are just guessing, and your competitors can easily challenge your claims.
You need high-precision instruments like differential pressure transmitters, online particle counters, and turbidity meters. These tools provide continuous, objective data on pressure drop and, more importantly, the actual particle removal efficiency of each filter cartridge, proving its true performance.

For a long time, the main indicator in filter tests was pressure drop. A filter was considered "good" if its differential pressure (DP) increased slowly. But this is only half the story. A filter can have a low DP simply because it isn’t capturing anything. That’s why we, at ecofiltrone, always insist on measuring what really matters: particle removal efficiency. This is where high-precision instruments become non-negotiable. They give you the power to see exactly what each filter is removing from the water in real-time. This moves the conversation from "my filter lasts longer" to "my filter provides cleaner water, and here is the data to prove it."
Beyond Pressure Drop: Measuring What Matters
To win a competitive trial, especially in a critical application like RO pre-filtration, you must provide proof of superior protection. This means measuring the particles that your filter stops.
| Performance Metric | Basic Measurement | Advanced Instrument | Why It’s Better for Proof |
|---|---|---|---|
| Pressure Drop | Manual Pressure Gauges | Differential Pressure (DP) Transmitter | Provides a continuous, logged data stream of the pressure drop, showing performance trends over time. |
| Particle Clogging | Silt Density Index (SDI) Kit | Online Turbidity Meter | Gives a real-time indication of water clarity, instantly showing the impact of any process upset. |
| Removal Efficiency | Lab Sample Analysis | Online Particle Counter | This is the key. It counts particles of specific sizes (e.g., 1μm, 5μm) before and after the filter, calculating real-time removal efficiency. |
Using an online particle counter is the most powerful tool in your arsenal. By placing sampling ports immediately before and after each filter housing, you can directly compare the particle count in the feedwater to the particle count in the filtered water. If the feedwater has 10,000 particles at 5 microns and your filtered water has only 100, you can prove a 99% removal efficiency. When you can show a chart where your filter consistently removes more particles than a competitor’s, you have hard evidence of superior performance. This is the data that convinces project managers.
How do you synchronize feedwater quality to avoid bias in your filtration efficiency data?
Your two test filters are showing very different results. You might blame the filter, but the real problem could be that one filter is getting "dirtier" water than the other.
You must use a single intake pump that feeds a manifold. This manifold then splits the feedwater into two identical streams, one for each filter. This is the only way to ensure both filters are challenged with the exact same water at the same time.
The principle of a side-by-side test is to compare two things under identical conditions. For filter testing, "identical conditions" starts with the water itself. It’s not enough to pull water from the same large tank. In a big tank, water quality can vary from one spot to another. One side might have slightly higher suspended solids than the other. If your two test filters pull from different spots, your test is invalid from the start. One filter might appear to clog faster simply because it’s doing more work. Synchronizing the feedwater is a simple mechanical step, but it is absolutely critical for data integrity. It ensures that any performance difference you measure is because of the filter, not because of a biased test setup.
The Anatomy of a Synchronized Feed System
Creating a truly synchronized feed system is straightforward if you follow a few basic engineering principles. It’s a core feature of the dual-stream pilot skid we discussed earlier. The goal is to make the path the water travels to each filter as identical as possible.
Here’s how we ensure perfect synchronization on our test skids:
- Single Source Pump: The entire system is fed by one pump. Using two pumps, even if they are the same model, can introduce slight variations in pressure and flow. A single pump eliminates this variable.
- Common Header Pipe: After the pump, the water flows into a single, common pipe or "header." This ensures the water is well-mixed and has a uniform composition before it is split.
- Symmetrical Split: The header pipe feeds into a symmetrical manifold, usually a T-junction or a specially designed flow splitter. This divides the water into two separate streams.
- Identical Stream Paths: After the split, the piping for both streams must be identical. This means using the same pipe diameter, the same length of pipe, and the same number and type of fittings (like elbows and valves) for each path leading to the filter housings.
This meticulous approach prevents any single filter from having an "easier" or "harder" path. Even a small difference, like an extra elbow on one side, can change flow dynamics and pressure, introducing a bias into your results. By ensuring perfect symmetry, you guarantee that the challenge presented to both filters is truly identical, making your final data trustworthy and defensible.
Is your data logging system robust enough to withstand 1,000+ hours of continuous desalination testing?
You are running a critical, long-term filter test. If your data logger fails or you lose the data, your entire expensive and time-consuming effort is completely wasted.
A robust system requires an industrial-grade PLC or data logger with automated cloud backup, remote monitoring, and enough memory for the whole test. It must reliably record sensor data every few minutes for over 1,000 hours, even in harsh site conditions.
A side-by-side test that runs for over a month generates a massive amount of data. We’re talking about pressure, flow rate, turbidity, and particle counts from multiple sensors, recorded every few minutes, 24/7. A simple laptop with a spreadsheet is not a solution; it’s a risk. I’ve heard stories of tests being ruined by a simple power outage or a computer crash. For a project worth millions of dollars, relying on flimsy data collection is not an option. You need an automated, industrial-strength system that is built for reliability. This system is your single source of truth. Its job is to capture every data point without fail, ensuring your final report is built on a complete and unbroken record of performance.
Hallmarks of a Reliable Data Logging System
Investing in a proper data logging system is just as important as investing in the filters themselves. It protects your time and your investment in the test. For long-duration trials of 1,000 hours or more, a consumer-grade solution is not enough. You need a system with features designed for industrial environments and mission-critical data.
| Feature | Why It’s Critical for Long-Term Tests |
|---|---|
| High Sampling Rate | The system must be able to log data from all sensors at a set interval (e.g., every 1-5 minutes). This captures performance fluctuations in detail. |
| Industrial-Grade Hardware | The logger (often a PLC) is built to withstand the temperature, humidity, dust, and vibrations common on a desalination project site. |
| Large Onboard Storage | It needs enough internal memory to store thousands of data points without needing to overwrite old data before the test is complete. |
| Automated Backup | The system should automatically back up data to a separate location, like a cloud server or a network drive. This protects against data loss from hardware failure or power loss. |
| Remote Access & Alarms | This allows engineers to check the test status from their office and receive automatic alerts (via email or SMS) if a parameter goes out of range, like a sudden pressure spike. |
A system with these features provides peace of mind. It ensures that after 42 days of continuous operation, you don’t just have an opinion about which filter is better—you have a complete, tamper-proof dataset to prove it. This level of professionalism and data integrity is what separates a guess from a guarantee.
Conclusion
A successful side-by-side test relies on a fair setup with a dual-stream skid, precise instruments to prove removal efficiency, synchronized feedwater, and a robust data logging system to capture everything.