How to Read ΔP Trends Across RO Security Filters
Rapid Answer
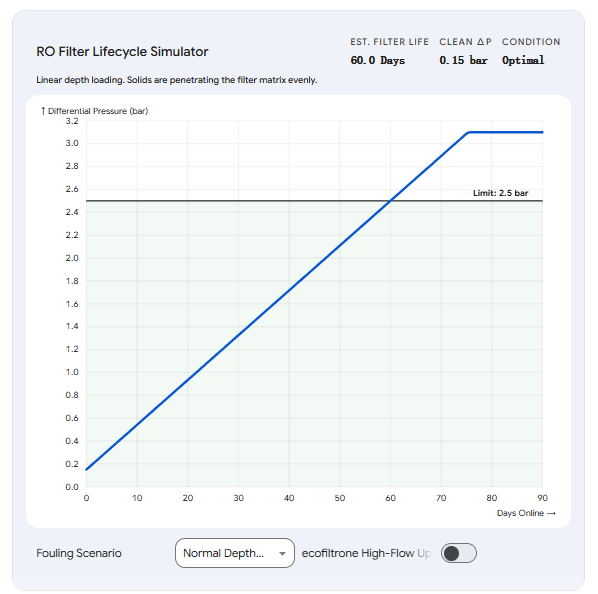
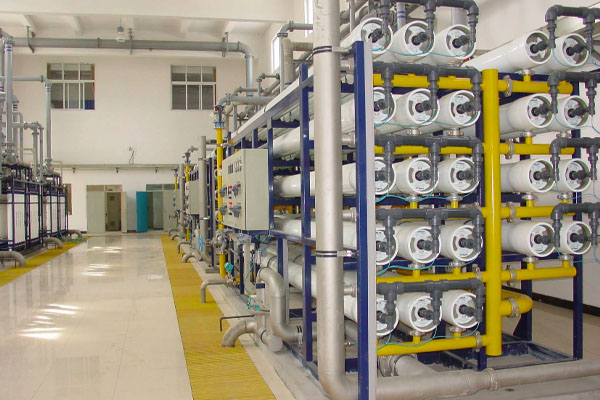
In the control room of a water treatment plant, the differential pressure (△P) gauge across the RO security filter is your most valuable diagnostic tool. Most operators only look at the gauge to see when it hits the 2.5 bar change-out limit. However, process engineers look at the shape of the △P curve to determine how the filter is failing.
Because fluid dynamics dictate how different contaminants interact with the filter media, the shape of the △P trend line over time acts as a physical signature. By analyzing whether the curve is linear, exponential, or stepped, you can scientifically deduce whether the system is experiencing normal depth loading, surface blinding, chemical carryover, or a catastrophic upstream mechanical failure.
The 3 Primary △P Curve Signatures
When you pull the historical trend data from the SCADA system, the △P curve will generally fall into one of three distinct shapes. Each shape requires a completely different operational response.
1. The Linear Climb (The "Healthy" Curve)
- The Shape: The △P starts around 0.1 to 0.15 bar and rises in a slow, steady, and highly predictable diagonal line over several weeks or months.
- The Physics: This is Depth Loading. Hard, suspended solids (like sand or pipe scale) are penetrating the 3D matrix of the pleated media. As the pores slowly fill up, the resistance increases proportionally.
- Diagnostic Inference: The upstream pre-treatment is stable. The filter is utilizing 100% of its physical dirt-holding capacity.
2. The Exponential "Hockey-Stick" (The Blinding Curve)
- The Shape: The △P starts low and remains completely flat for a period of time. Then, without warning, it curves upward and shoots vertically to the 2.5 bar alarm limit in a matter of hours or days.
- The Physics: This is Surface Blinding. Soft, deformable contaminants (biological EPS, trace oils) or unreacted polymers are hitting the media. Initially, the fluid finds alternative paths, keeping the △P flat. But once the outermost surface is completely coated in a liquid gel, all pores are sealed simultaneously, causing an infinite resistance spike.
- Diagnostic Inference: You are dealing with colloidal agglomeration or upstream chemical overdosing. The internal layers of the filter are completely clean, but the surface is choked.
3. The Vertical Step (The Transient Shock)
- The Shape: The △P is completely flat and stable. Suddenly, in a single data logging interval (e.g., 5 minutes), the △P jumps vertically from 0.2 bar to >2.5 bar, often triggering an automatic plant shutdown.
- The Physics: This is a Hydraulic Shock or Crud Burst. A massive, concentrated wave of solid dirt or a severe pressure hammer has violently compacted the filter media instantly.
- Diagnostic Inference: Look upstream immediately. This signature proves a UF hollow fiber has snapped, an O-ring has failed, or a pump VFD has surged out of control.
Diagnostic Cross-Validation Matrix
Use this matrix to translate SCADA screen data directly into field action.
| SCADA △P Signature | Required Cross-Validation | Engineering Root Cause & Action |
|---|---|---|
| Linear climb over 45+ days | Check filter autopsy: should be heavy and packed with hard dirt. | Normal Operation: Filter is correctly sized. No action required. |
| Hockey-stick spike in 3-10 days | Check upstream DAF coagulant dosing and RO feed SDI. | Polymer / Colloidal Blinding: Reduce upstream chemical dosing immediately. |
| Hockey-stick spike in 15-20 days | Check chlorine residual and smell the exhausted filter for earthy odors. | Biofouling (EPS): Shock dose the system with biocide to clear the permeate headers. |
| Instant vertical step (Minutes) | Check UF turbidity and perform a Direct Integrity Test (DIT). | Mechanical Bypass: Isolate the broken UF rack before the security filter ruptures. |
The ecofiltrone TCO Upgrade: Flattening the Curve
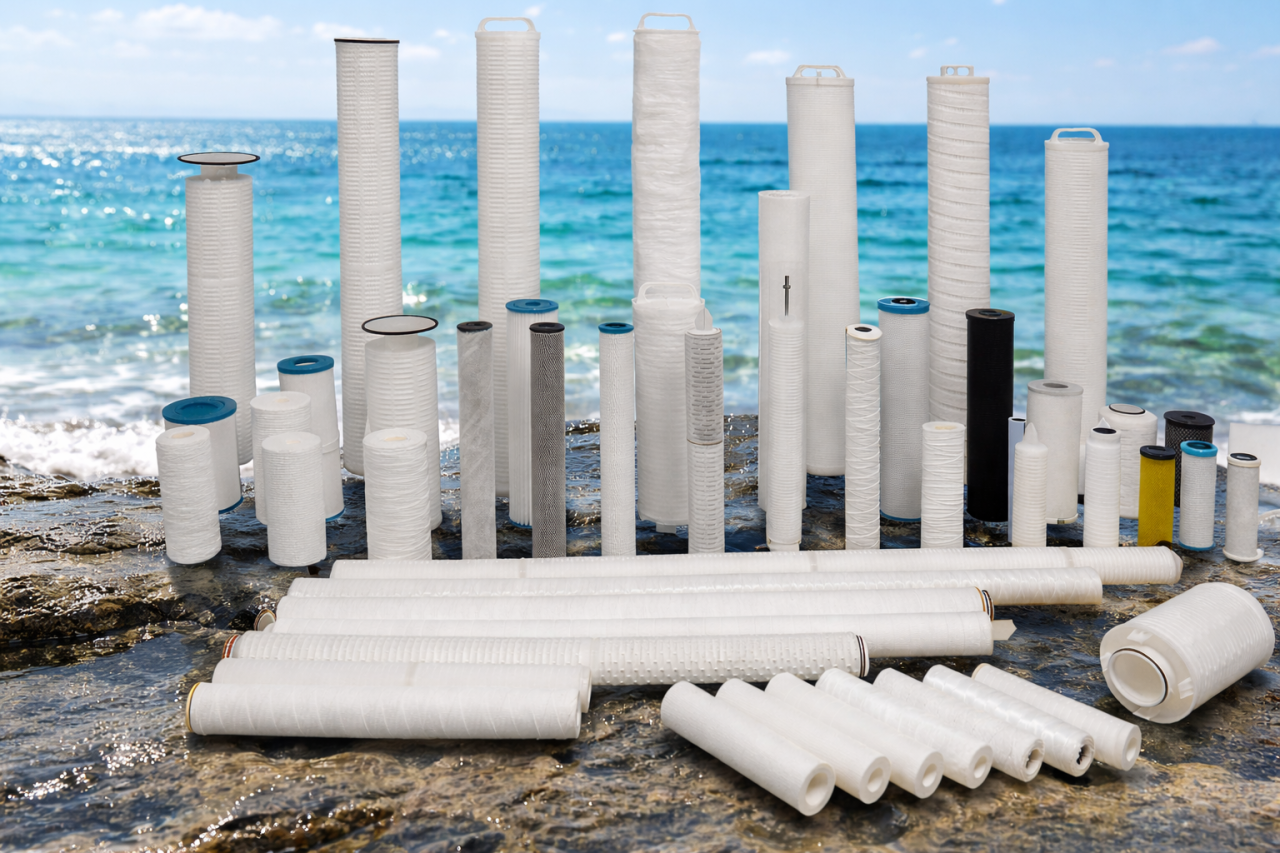
If your plant is plagued by "hockey-stick" blinding curves, the mathematical solution is not to buy filters with a higher micron rating. You must alter the fluid dynamics to delay the exponential spike.
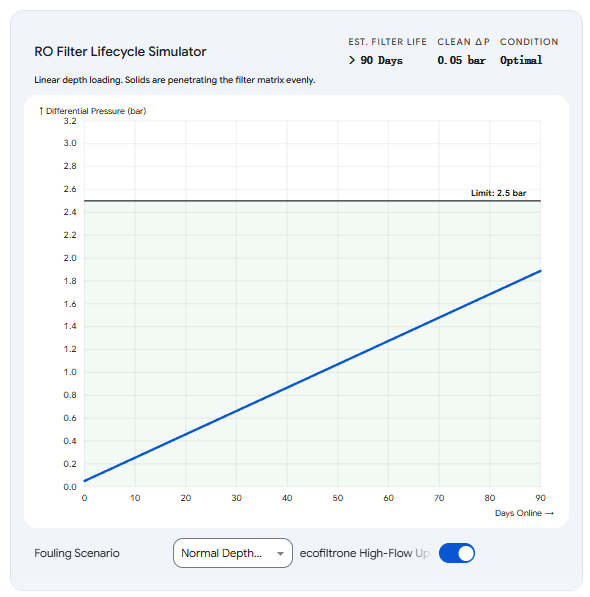
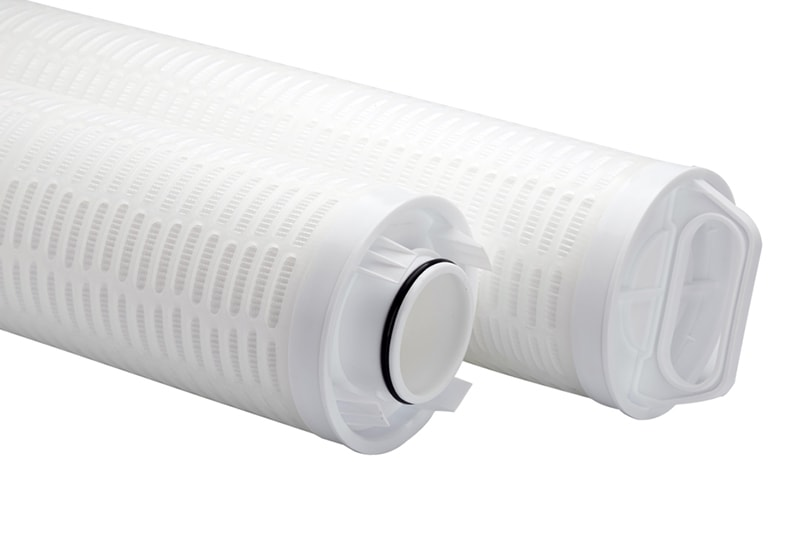
By upgrading to ecofiltrone High-Flow Pleated Cartridges, you radically increase the filtration surface area, which drops the flux rate (fluid velocity).
- Lowering the Baseline: The massive surface area drops your clean initial △P from 0.2 bar down to 0.05 bar, giving you maximum "pressure runway."
- Stretching the Hockey Stick: At an ultra-low flux rate, soft gels and colloids cannot compact tightly enough to form an impermeable liquid block. The exponential spike is delayed exponentially, pushing a 10-day filter failure out to 40 or 50 days, thereby rescuing your OPEX budget.
Explore the interactive widget below to simulate how different fouling mechanisms generate these specific △P curves, and see how upgrading to an ecofiltrone high-flow housing alters the fluid dynamics to protect your system.