Are you tired of throwing away expensive filters that still have life in them? This guessing game wastes money, but not replacing them risks your entire system.
The future of industrial filter maintenance is data-driven. By using industrial IoT sensors to monitor real-time pressure differences, you can accurately predict a filter’s remaining lifespan. This shifts you from a fixed schedule to a smarter, predictive model that saves money and ensures system safety.
This change is more than just new technology. It’s a completely new way to think about how we manage essential industrial parts. I’ve seen countless companies struggle with the old "replace it just in case" method. It feels safe, but it’s incredibly inefficient. Let’s explore how a data-first approach can transform your operations and your bottom line. Are you ready to stop guessing and start knowing?
Why does the traditional "regular replacement plan" always lead to the waste of expensive filter materials?
Does your team follow a strict replacement schedule? It feels like the responsible thing to do, but it often means you’re discarding filter cartridges that are still working perfectly.
Traditional plans are based on worst-case scenarios, not the actual condition of your filter. This conservative approach ignores real-time variables like water quality fluctuations, leading to premature replacement and wasting up to 20% of a filter’s effective life and your budget.
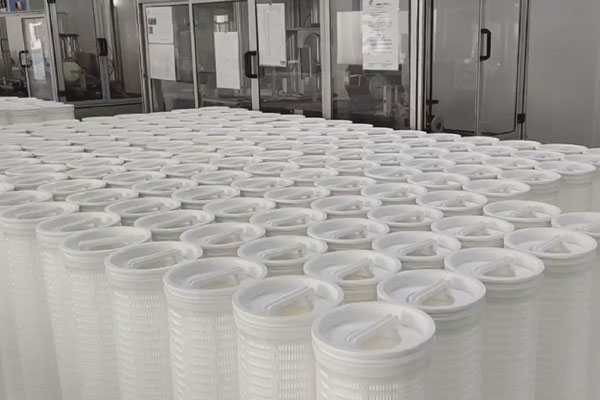
At Ecofiltrone, we often visit facilities and see this problem firsthand. A client might replace their high-flow filter cartridges every three months, like clockwork. This schedule was likely created based on a time when their influent water quality was at its worst. But what about the periods when the water is cleaner? The filters are not working as hard during those times. The time-based plan doesn’t account for this. It treats every day as the worst day, which is an expensive way to operate. This rigid approach is the core reason for waste. It’s a blunt instrument in a job that requires precision.
The Flaw in "Time-Based" Logic
The logic is simple: prevent failure at all costs. But the cost is often hidden in your operational budget. A fixed schedule creates a "safety buffer" that guarantees you replace the filter before it could ever fail, but it also guarantees waste.
| Factor | Scheduled Replacement Assumes | Real-World Condition |
|---|---|---|
| Influent Quality | Constantly poor | Varies daily, often clean |
| System Load | Maximum, 24/7 operation | Fluctuates with production cycles |
| Filter Lifespan | A fixed date (e.g., 90 days) | Dynamic, depends on actual use |
This table shows the gap between assumption and reality. Your system is dynamic, so your maintenance plan should be too. Relying on a calendar means you are making decisions without the most important piece of information: how the filter is actually performing right now.
How can the critical point of physical failure of the filter element be accurately captured through real-time differential pressure monitoring?
Guessing when a filter will clog is a high-stakes game. Replace it too early, you waste money. Replace it too late, you risk damaging expensive downstream equipment.
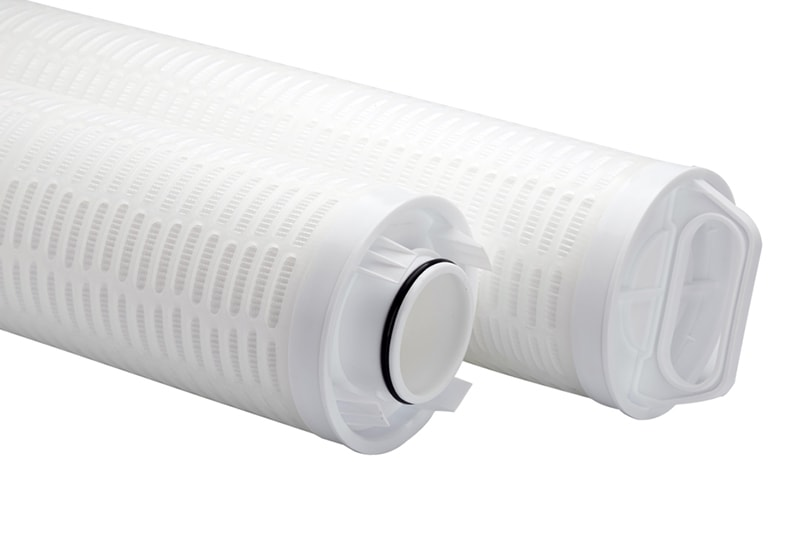
By installing pressure sensors before and after the filter housing, you can monitor the differential pressure (DP). As the filter captures contaminants, the DP rises. Setting a specific DP threshold lets you pinpoint the exact moment for replacement, just before performance drops.
Think of differential pressure as the blood pressure of your filtration system. A healthy, clean system has low pressure. As the filter does its job and gets clogged with particles, the pressure builds up. The pump has to work harder to push water through. This increase in effort is what we measure as differential pressure. It’s a direct, real-time indicator of the filter’s health. In my experience helping clients set up these systems, the "aha" moment comes when they see the DP data on a screen. It changes the filter from a simple consumable part into a vital data point for their entire operation.
Turning Pressure Data into Actionable Insights
This data isn’t just a number; it’s a signal for action. The process is straightforward. First, you establish a baseline DP with a clean filter cartridge. Then, you track how that DP increases over time. The final step is to define the "terminal DP"—the maximum allowable pressure difference before the filter is considered at the end of its useful life. This number is critical. It ensures you get the maximum value from every filter without ever risking your system.
| Filter Stage | Differential Pressure (DP) | System Status | Action Required |
|---|---|---|---|
| New Filter | Low (e.g., < 0.05 MPa) | Optimal Flow, Low Energy Use | Monitor Data |
| Partially Clogged | Moderate (e.g., 0.05 – 0.14 MPa) | Normal Operation | Continue Monitoring Trend |
| Nearing End-of-Life | High (e.g., ≥ 0.15 MPa) | Reduced Flow, High Pump Energy | Schedule Replacement |
This method removes all the guesswork. You no longer have to wonder if a filter is good for another week. The data tells you exactly when to act, turning maintenance from a reactive or arbitrary task into a precise, planned activity.
After introducing digital operation and maintenance, how much profit can enterprises save from labor costs and spare parts turnover?
Managing filter inventory and scheduling maintenance crews is a constant juggling act. It ties up your capital in spare parts and your team’s time in manual checks.
Enterprises can save significantly. Predictive maintenance directly cuts spare parts costs by 15-20% by eliminating unnecessary replacements. It also reduces labor spent on manual checks and allows for a leaner, just-in-time inventory, freeing up both capital and personnel.
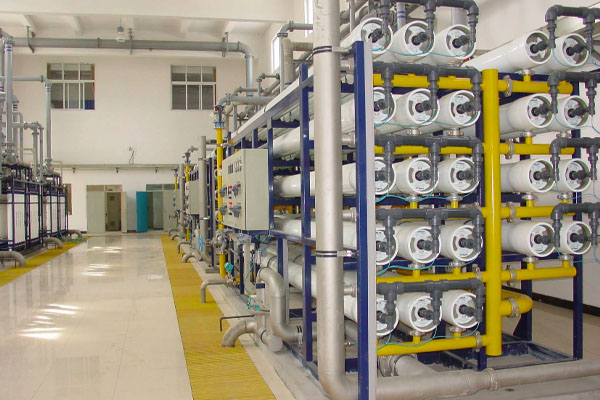
The financial impact of switching to a digital approach is immediate and substantial. We work with project managers whose main goal is to reduce long-term operational costs. When we help them implement a DP monitoring system for our high-flow filter cartridges, they see savings in multiple areas. They buy fewer filters over the year because they use each one to its full potential. Their maintenance teams spend less time walking the floor to perform manual checks. Instead, they can monitor system health from a central control room and only dispatch technicians when the data tells them to. This is a smarter way to work.
A Breakdown of the Digital Dividend
The savings go beyond just buying fewer filters. A truly optimized system saves money on labor, inventory, and even energy. When a filter becomes clogged, your pumps have to work harder, consuming more electricity. By replacing filters at the optimal DP, you keep your pumps operating efficiently.
| Cost Category | Traditional "Scheduled" Method | Digital "Predictive" Method | Estimated Savings |
|---|---|---|---|
| Filter Consumables | Premature replacement, high waste | Extended use, replace only when needed | 15-20% |
| Labor Costs | Frequent, routine manual checks | Automated monitoring, "management by exception" | 50%+ reduction in inspection time |
| Inventory Costs | Large "safety stock" required | "Just-in-time" ordering based on data | Reduced warehouse space & capital |
| Energy Costs | Pumps work against high DP | Optimized replacement, lower average DP | 5-10% in pump energy use |
These numbers represent a real shift in operational efficiency. It’s about getting more from your assets, your people, and your budget. As a supplier, our goal at Ecofiltrone is not just to sell a product. It’s to provide a solution that makes our clients’ operations more profitable and reliable.
Conclusion
Switching from scheduled to predictive filter maintenance with real-time data is essential. It cuts waste, saves money on labor and parts, and boosts your overall system efficiency.