What is the difference between NTU (turbidity) and SDI?
You see NTU and SDI values on your water reports, but they don’t seem to line up. This confusion can lead to disastrous decisions for your RO system’s health and performance.
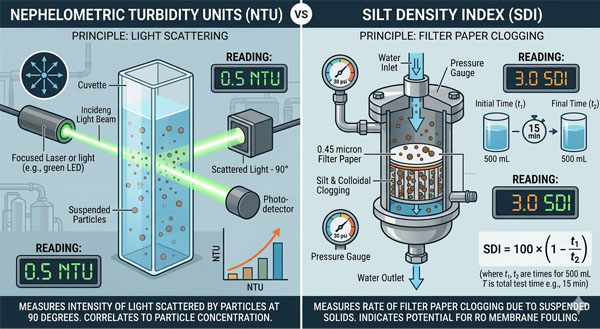
No, they are fundamentally different. NTU (Nephelometric Turbidity Units) measures water cloudiness by scattering light. SDI (Silt Density Index) measures the water’s potential to plug a membrane by physically passing it through a filter and timing the flow decay.
Early in my career, I was troubleshooting an RO system that was fouling constantly. The client was frustrated. He kept showing me his reports and saying, "But look, Doris, my turbidity is less than 1 NTU! The water is clean!" He was right, the water looked perfectly clear. But when we ran an SDI test, it was over 6. The water was full of fine, sticky colloidal particles that didn’t scatter light well but were experts at plugging membranes. That day, I learned the most important lesson in RO pre-treatment: what you can’t see is often what hurts you the most.
What Is NTU Actually Telling You About Your Water?
Your online meter reads a very low NTU, so you assume the water quality is excellent. But downstream, your high-efficiency cartridges are clogging up faster than you expected.
NTU only tells you how cloudy or hazy your water is. It’s an optical measurement of how much light is scattered by the suspended particles. It gives no information about the particle size, type, or stickiness.
Think of NTU like this: you are standing in a large room. If the room is full of tiny dust motes, a sunbeam coming through the window will be very visible. That is high turbidity. If the air is clear, the beam is almost invisible. That is low turbidity. The NTU meter does the same thing but with a controlled light source and a detector at a 90-degree angle to measure the scattered light. It is a fantastic, instant indicator of general water clarity. It is great for monitoring things like a clarifier or a media filter to see if there has been a major upset. But it has a huge blind spot. It cannot tell the difference between hard, non-sticky silt and soft, membrane-plugging organic colloids. For the NTU meter, they might both look the same.
NTU: Strengths vs. Limitations
| Strengths | Limitations |
|---|---|
| Instantaneous: Provides real-time, online data. | Doesn’t measure plugging potential: Low NTU does not guarantee low fouling. |
| Great for general clarity: Excellent for monitoring bulk solids removal. | Particle type matters: Can’t distinguish between sticky and non-sticky particles. |
| Simple and widely used: A common water quality parameter. | Unreliable for predicting RO performance: Not the right tool for membrane protection. |
Why is SDI the Only Number That Matters for Your RO System?
Your NTU is under control, but you are still spending a fortune on membrane cleaning chemicals and downtime. You are fighting an enemy you can’t see and can’t measure with your current tools.
SDI is a direct physical test that simulates how your water will clog an RO membrane. It measures the rate of plugging of a 0.45-micron filter paper, giving you a direct indication of the fouling potential from silt, colloids, and fines.
Unlike the indirect optical measurement of NTU, the SDI test is brutally direct. You force water at a constant pressure (30 psi) through a small, white 0.45-micron filter disc. You time how long it takes to collect an initial 500 mL sample (t₀). Then, you let the water keep flowing for 15 minutes. After 15 minutes, you time how long it takes to collect a final 500 mL sample (t₁₅). The flow rate will have dropped because the filter has started to clog. The SDI value is calculated from the percentage of flow decay. It is essentially a miniature, accelerated fouling test. For an RO system engineer like Jacky, this is the gold standard. Membrane manufacturers base their warranties on the feed water having an SDI₁₅ of less than 5, and most recommend a target of less than 3 for reliable operation. SDI tells you exactly what the membranes are going to experience.
Understanding SDI Values
| SDI₁₅ Value | Meaning | Recommended Action |
|---|---|---|
| < 3 | Low fouling potential. | Ideal for RO systems. This is the target. |
| 3 – 5 | Medium fouling potential. | Acceptable, but may require more frequent membrane cleaning. |
| > 5 | High fouling potential. | Unacceptable for RO feed. Will cause rapid, severe fouling. Pre-treatment must be improved. |
Can You Predict SDI from an NTU Reading?
Taking manual SDI measurements is slow and inconvenient. You wish you could just use your fast, online NTU meter and a conversion chart to know your fouling risk instantly.
No, there is no reliable, universal formula to convert NTU to SDI. A low NTU reading does not guarantee a low SDI value, because the plugging nature of particles is completely independent of their light-scattering properties.
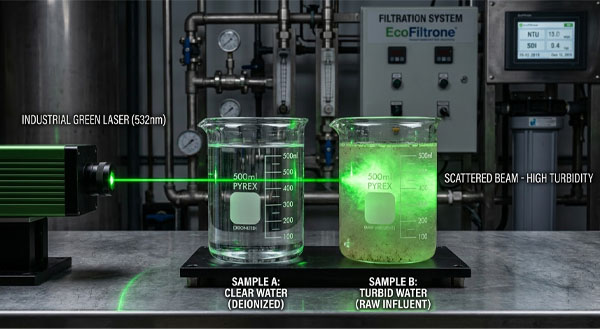
This is the most critical point to understand. Many people try to find a correlation, but it is a fool’s errand. Let’s imagine two different water sources, both with a turbidity of 1.0 NTU.
- Water Source A: The turbidity is caused by very fine, hard, spherical silica particles. They scatter light, but they don’t easily stick to a surface. This water might have a very low SDI of 2.
- Water Source B: The turbidity is caused by long, sticky organic molecules (colloids). They don’t scatter light very well, but they are incredibly effective at sticking to and coating a surface. This water could have a dangerously high SDI of 7.
An NTU meter cannot tell the difference between these two scenarios. But your RO membranes can. They will run perfectly on Water A and fail in a matter of days on Water B. This is why you must measure both. Use NTU as your fast, general indicator, but trust only SDI to tell you if your water is safe for your membranes.
Conclusion
NTU measures how water looks, but SDI measures how it behaves. For protecting your RO investment and ensuring reliable performance, SDI is the only measurement that truly predicts fouling potential.