What is the "Beta Ratio" of a filter cartridge? How can its calculation method be explained to customers in simple terms?
You’re comparing filter data sheets and see ratings like "β₅ = 1000." It looks like complex math, leaving you unsure if you’re truly comparing products on an equal footing.
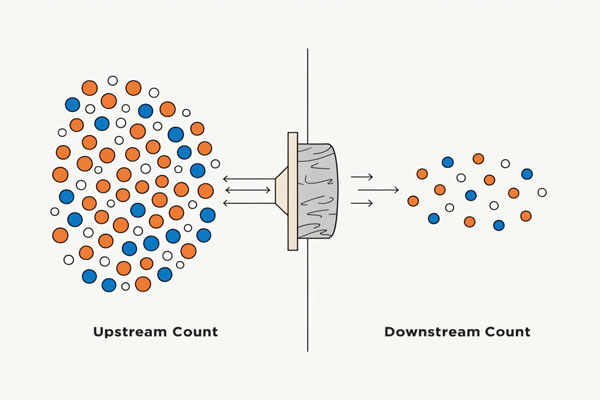
Beta Ratio is a filter’s efficiency score at a specific particle size. It’s calculated by dividing the number of particles going into the filter by the number of particles that get out. A higher number means a better, more efficient filter.
I remember being in a meeting with a new client who was having trouble with their hydraulic systems. They kept buying "10-micron" filters from different suppliers, but their oil analysis reports were all over the place. One brand seemed to work okay, while another was completely ineffective. The problem wasn’t the micron rating—it was the Beta Ratio. One filter was "nominal" with a low Beta Ratio, while the other was "absolute" with a very high one. Once I explained that Beta Ratio was a simple score of how well the filter actually worked, the lightbulb went on. It’s not just a number for engineers; it’s the most honest way to understand and compare filter performance.
What does a Beta Ratio number actually tell you?
You see big numbers like 1000 or 5000. They sound impressive, but what is the real-world difference between them, and how does that translate into performance in your system?
A Beta Ratio tells you the filter’s capture efficiency for a specific particle size. For example, a Beta 1000 rating at 5 microns means that for every 1000 particles of 5 microns entering the filter, only one gets through.
Think of the Beta Ratio as a bouncer at a nightclub. The number tells you how strict that bouncer is. If 1000 people (particles) of a certain size try to get in, and the bouncer (filter) only lets one person through, that’s a Beta Ratio of 1000. This number is always tied to a specific particle size, which is shown as a subscript, like β₅ = 1000. This means the filter has a Beta Ratio of 1000 for 5-micron particles. It’s a direct and powerful way to express efficiency. We can easily convert this ratio into a simple percentage that everyone understands. A higher Beta Ratio means a higher efficiency, which is critical for protecting sensitive downstream equipment. Choosing a filter with a high Beta Ratio is choosing a reliable guard for your system.
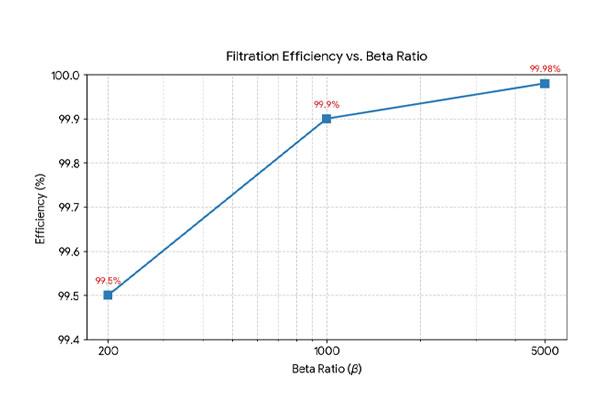
Beta Ratio to Efficiency Conversion Table
| Beta Ratio (β) | Efficiency (%) | What It Means |
|---|---|---|
| β 200 | 99.5% | For every 200 particles that enter, 1 gets out. |
| β 1000 | 99.9% | For every 1000 particles that enter, 1 gets out. |
| β 5000 | 99.98% | For every 5000 particles that enter, 1 gets out. |
How is the Beta Ratio actually measured in a lab?
It’s easy for a manufacturer to print a high number on a data sheet. How do you know that the Beta Ratio is a real, trustworthy number based on a fair test?
Beta Ratio is measured using a standardized multi-pass test (like ISO 16889). Contaminated fluid is pumped through the filter in a loop, and precise particle counters upstream and downstream measure the difference to calculate the ratio accurately.
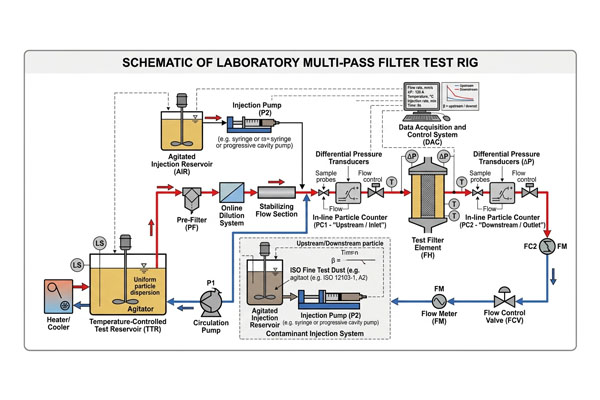
The number isn’t just made up; it comes from a rigorous and repeatable lab test. I’ve seen these test rigs in person, and they are quite sophisticated. The basic idea is simple. We create a closed loop and pump a specific fluid (like hydraulic oil) through it. Then, we add a standardized test dust that contains a known distribution of particle sizes. There are two highly accurate laser particle counters in the loop. One is positioned just before the filter (upstream), and the other is right after it (downstream). As the contaminated fluid circulates, the counters continuously measure particles of different sizes. The test runs until the filter reaches a specific terminal pressure drop, simulating the end of its life. The data from the two counters gives us the numbers we need to calculate the Beta Ratio for each particle size. Using a standard like this means you can compare filters from different companies on a true apples-to-apples basis.
How can you explain the calculation to a non-technical customer?
You understand the concept, but now you need to explain it to your manager or a client to justify the cost of a high-performance filter. How do you make it simple and clear?
Explain it like this: "Imagine 1000 dirt particles trying to get past a gate. A filter with a Beta Ratio of 1000 lets only one particle through. The calculation is simply: Particles In ÷ Particles Out = Beta Ratio."
![]()