Why is the pressure drop curve of a high-flow filter cartridge usually a parabola (rising sharply in the later stages) instead of a straight line?
You watch your pressure gauge climb steadily, then it suddenly shoots up. This unexpected spike forces a costly, unplanned shutdown, and you wonder why it wasn’t a straight, predictable line.
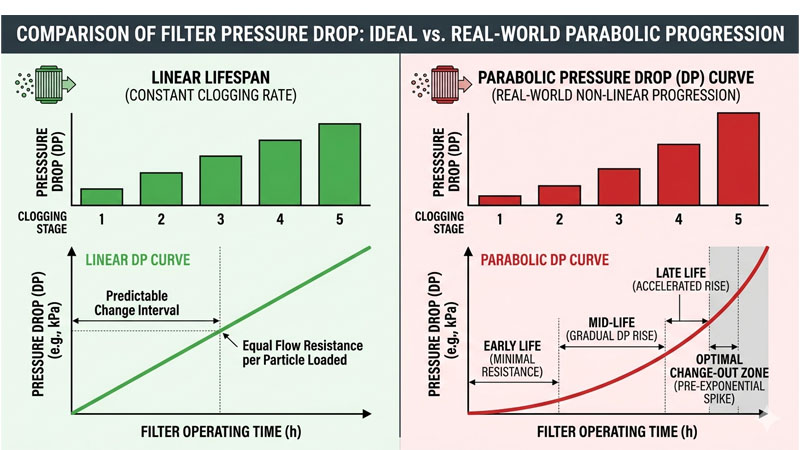
The pressure drop curve is parabolic because as the filter clogs, fluid velocity through the remaining open pores increases. Since pressure drop is related to the square of velocity, the resistance accelerates dramatically in the later stages, causing a sharp, non-linear rise.
When I was just starting out as an engineer, I used to think of a filter like a simple bucket filling with sand. I expected the pressure drop to increase in a straight line as it got full. I even tried to create a linear chart to predict when filters would need to be changed. It never worked. The filters would be fine for weeks, and then fail in a matter of hours. The real process is much more dynamic. It wasn’t until I started thinking about the fluid’s speed, not just the amount of dirt, that it all made sense. The curve tells a story about the changing battle between the fluid and the filter media.
Why is the initial pressure drop so low and stable?
You install a new high-flow cartridge, and the pressure drop is incredibly low. This stability feels great, but you worry when the inevitable rise will begin to happen.
Initially, a new filter has a massive number of open pores, creating a huge area for fluid to pass through. This results in very low fluid velocity and minimal resistance. The curve stays flat as only the largest particles are captured.
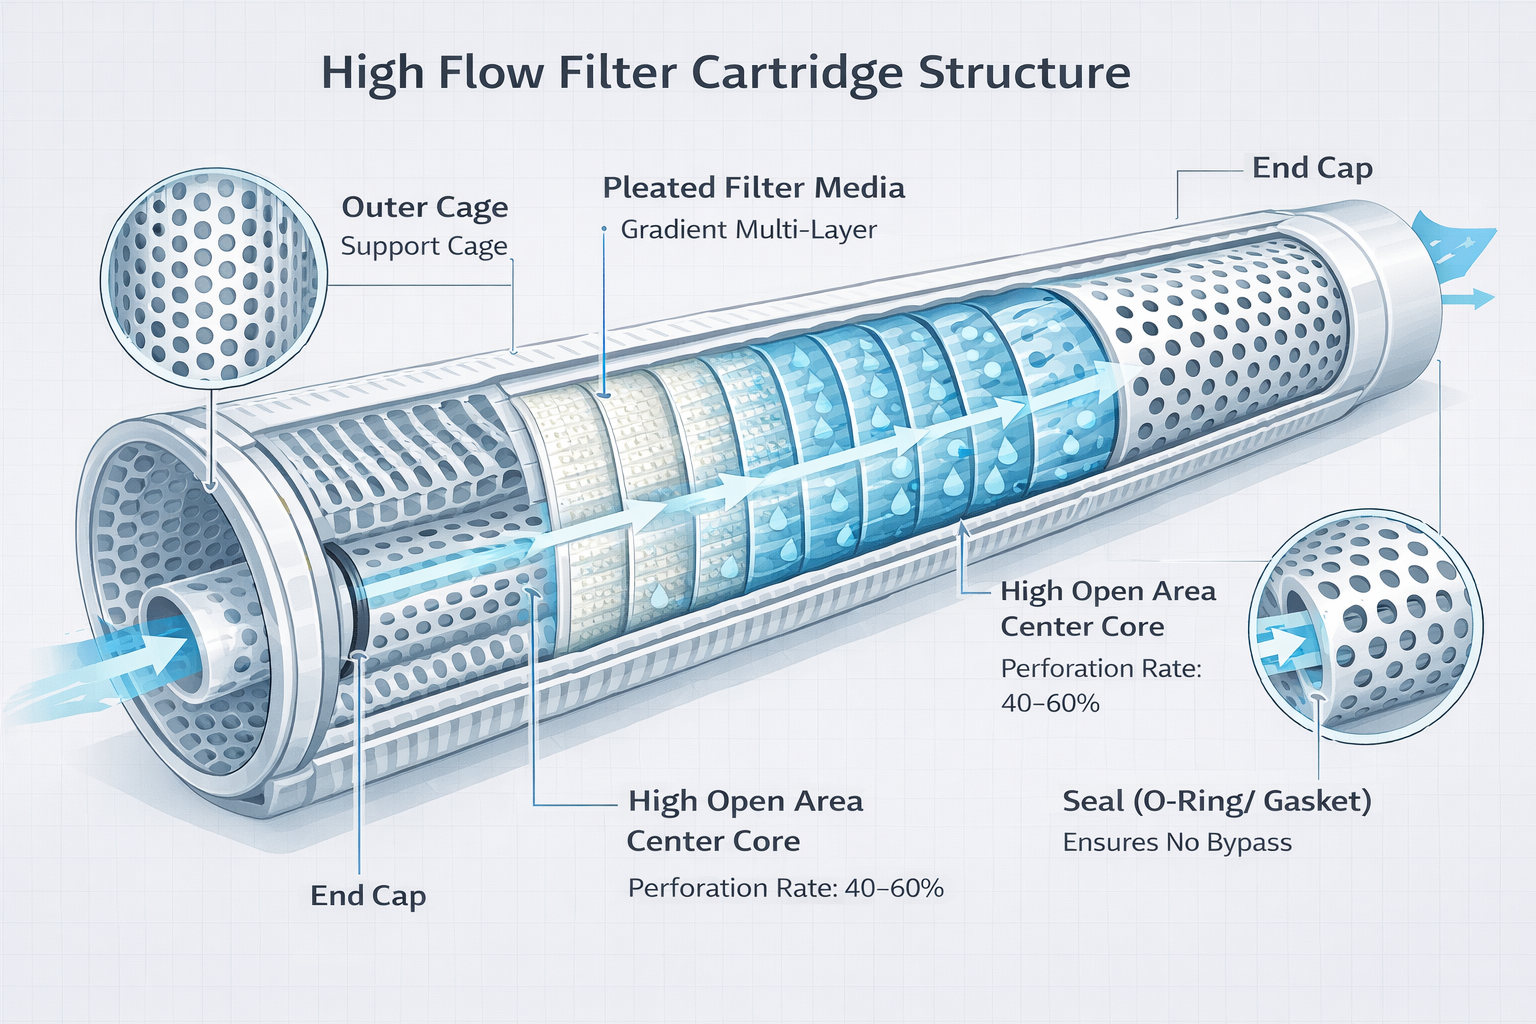
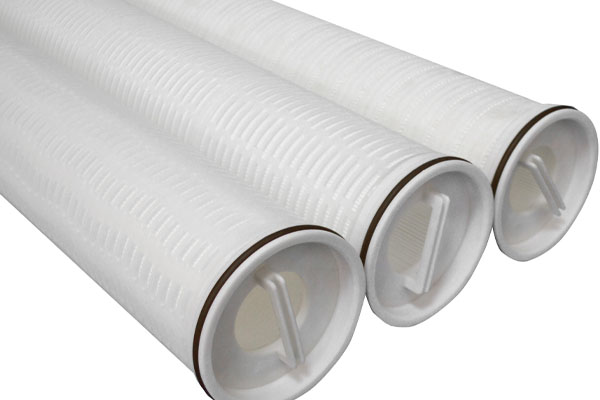
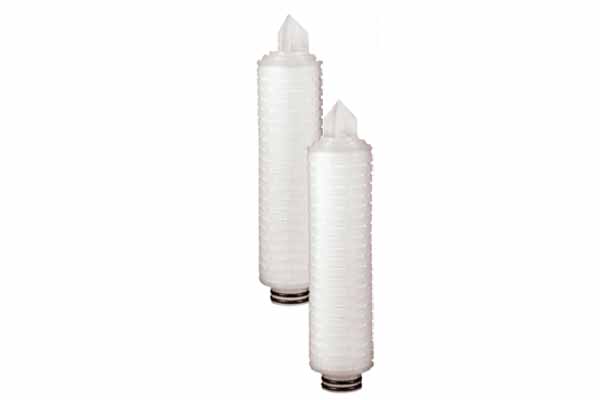
A new high-flow filter is an amazing piece of engineering. It’s a vast, three-dimensional labyrinth with an enormous amount of open space. When you first start pumping fluid through it, the fluid has thousands of easy paths to take. This is the "depth filtration" phase. The outer layers of the filter, with their larger pores, begin to capture the biggest particles, but these particles are spread out over a huge area. Think of it like the first few cars entering a giant, empty parking garage. They can park anywhere without slowing down the flow of traffic at the entrance. Because the total available area for flow is so large, the fluid’s velocity is very low. Since pressure drop is directly related to fluid velocity and resistance, the initial pressure drop is minimal. The curve remains flat because capturing these first particles barely changes the filter’s overall low resistance.
What causes the curve to start bending upwards?
Your filter’s pressure has been flat for weeks, then it starts to rise noticeably. You wonder if this is the beginning of the end or just a normal part of the cycle.
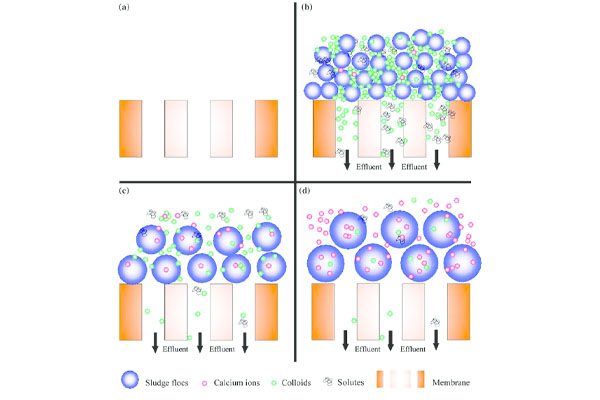
The curve bends upward as the filter’s depth-loading capacity is used up. It begins to build a "filter cake" on the surface. Now, new particles block already-constricted pathways, causing resistance to increase at a much faster, non-linear rate.
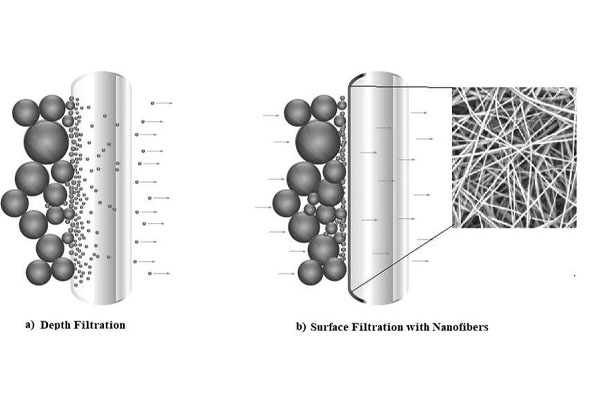
This is the transition point where the filter’s behavior changes. Most of the larger pores within the filter’s depth are now full. The filter stops behaving like a deep sponge and starts acting more like a screen. The captured particles begin to form a layer on top of the filter media, which we call a "filter cake." This cake itself becomes a new, and usually less permeable, filter layer. Now, when a new particle arrives, it doesn’t just fill an empty space. It lands on the filter cake, making the path for fluid even narrower and more difficult. The total area available for flow is shrinking much faster now. To maintain the same flow rate, the fluid must speed up as it squeezes through these fewer, smaller openings. This increasing velocity is what causes the pressure drop to start rising more quickly. This is the point where the curve on your graph clearly changes from flat to a noticeable upward slope.
Why does the pressure skyrocket at the very end?
The pressure gauge was rising steadily, but now it’s shooting toward the red line. This rapid acceleration gives you almost no time to plan a change-out, creating an emergency.
At the end, the filter is almost completely blinded by a dense filter cake. Fluid velocity through the few remaining microscopic channels becomes extremely high. This causes an exponential, near-vertical rise in pressure drop as the filter completely plugs up.
The final stage is where the physics gets extreme. The filter cake is now thick and compacted. Over 95% of the flow paths might be completely blocked. Your pump, however, is still trying to push the same volume of fluid through the filter. This entire flow is now forced through the few tiny, microscopic channels that remain. The fluid velocity in these channels becomes incredibly high. The key principle here is that pressure drop increases with the square of the velocity. If you double the velocity, you get four times the pressure drop. In this final stage, the velocity might increase ten-fold, resulting in a hundred-fold increase in resistance. This is why the curve goes almost vertical. The filter is "blinded." Adding even a tiny amount of new dirt at this stage can be enough to close off the last remaining paths, causing the pressure to spike to the system’s limit.
| Stage | Filter Condition | Flow Path | ΔP Behavior |
|---|---|---|---|
| Beginning | Clean, open pores | Wide, low velocity | Flat, very low |
| Middle | Depth loaded, cake forming | Narrowing, increasing velocity | Rising, curved |
| End | Blinded, dense cake | Microscopic, extreme velocity | Exponential, skyrockets |
Conclusion
The parabolic curve reflects the filter’s journey from easy depth loading to difficult surface blinding. Understanding this helps you predict filter life and prevent unexpected system shutdowns by changing filters on time.